💡 Business Problem
- Provided insights, and defined causal effects: We’d lie to provide a better understanding of the characteristic features of respondents, and we also wanted to describe customer segmentation based on customers’ behaviors.
- Maximized the profit: We would like to build 2 predictive models for their next marketing campaign.
📊 Dataset
The dataset comprises 20 columns and 2240 rows. Data Dictionary:
| Feature | Description |
|---|---|
| ID | Unique identifier for each customer |
| Year_Birth | Customer’s year of birth |
| DtCustomer | Date of customer’s enrollment with the company |
| Education | Customer’s level of education |
| Marital | Customer’s marital status |
| Kidhome | Number of small children in customer’s household |
| Teenhome | Number of teenagers in customer’s household |
| Income | Customer’s yearly household income |
| MntFishProducts | Amount spent on fish products in the last 2 years |
| MntMeatProducts | Amount spent on meat products in the last 2 years |
| MntFruits | Amount spent on fruit products in the last 2 years |
| MntSweetProducts | Amount spent on sweet products in the last 2 years |
| MntWines | Amount spent on wine products in the last 2 years |
| MntGoldProds | Amount spent on gold products in the last 2 year |
| NumDealsPurchases | Number of purchases made with discount |
| NumCatalogPurchases | Number of purchases made using catalogue |
| NumStorePurchases | Number of purchases made directly in stores |
| NumWebPurchases | Number of purchases made through company’s website |
| NumWebVisitsMonth | Number of visits to company’s website in the last month |
| Recency | Number of days since the last purchase |
🛠️ Tools
- Tools: MySQL, R
- Skills: Stepwise Regression, Semi-Log Regression Model
🔬 Methodology
1. Data Cleaning
a. Missing values: Some columns may have missing values represented as NULL using CASE statement. b. Dummy variables on the amount spent (wine, meat, fruit, etc): <= $10 : 0 and >$10 : 1
2. Exploratory Data Analysis (EDA)
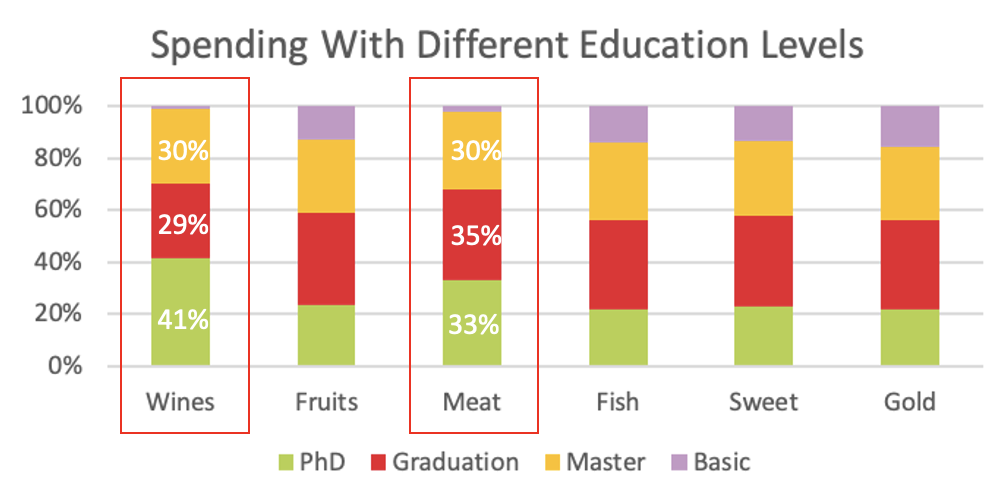
a. Education Effect: Education leads to higher income, also resulting in higher total spending. Customers with higher education levels and households without kids or teens are more willing to spend more on higher-priced groceries.

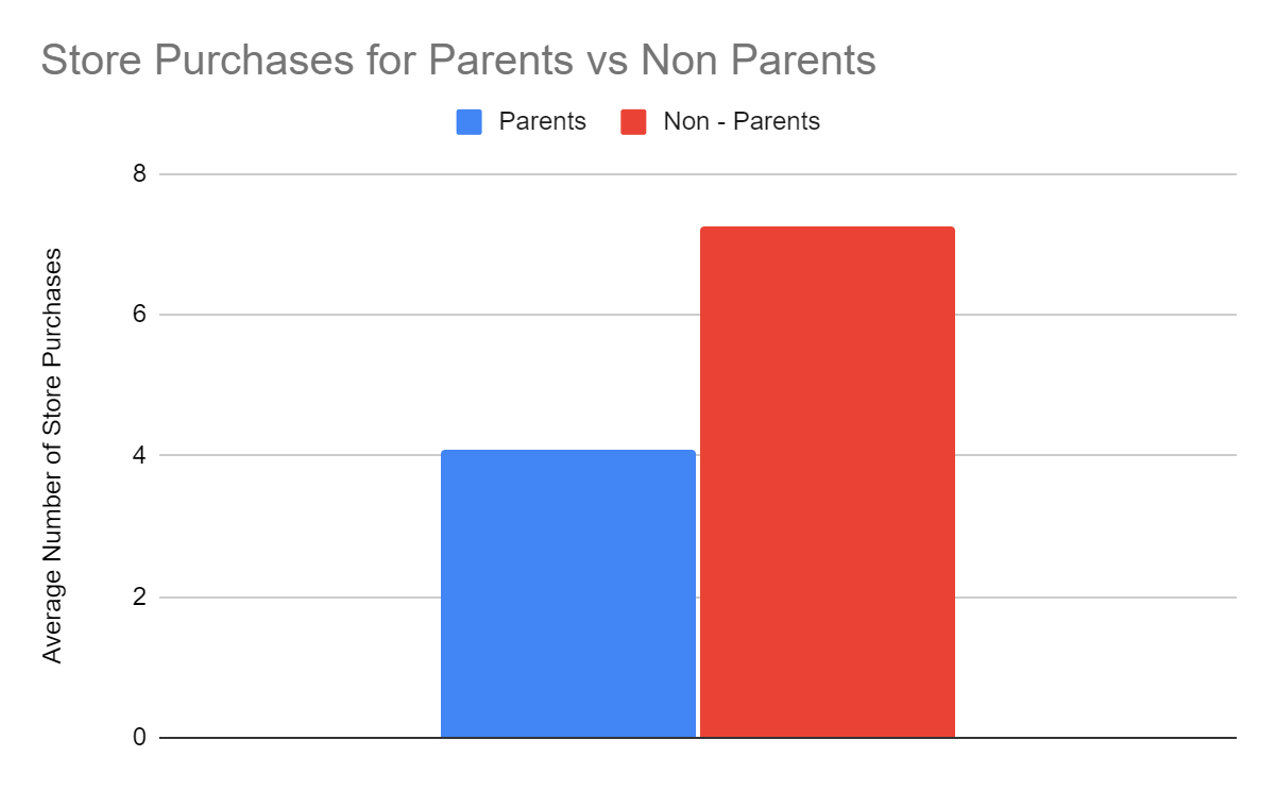
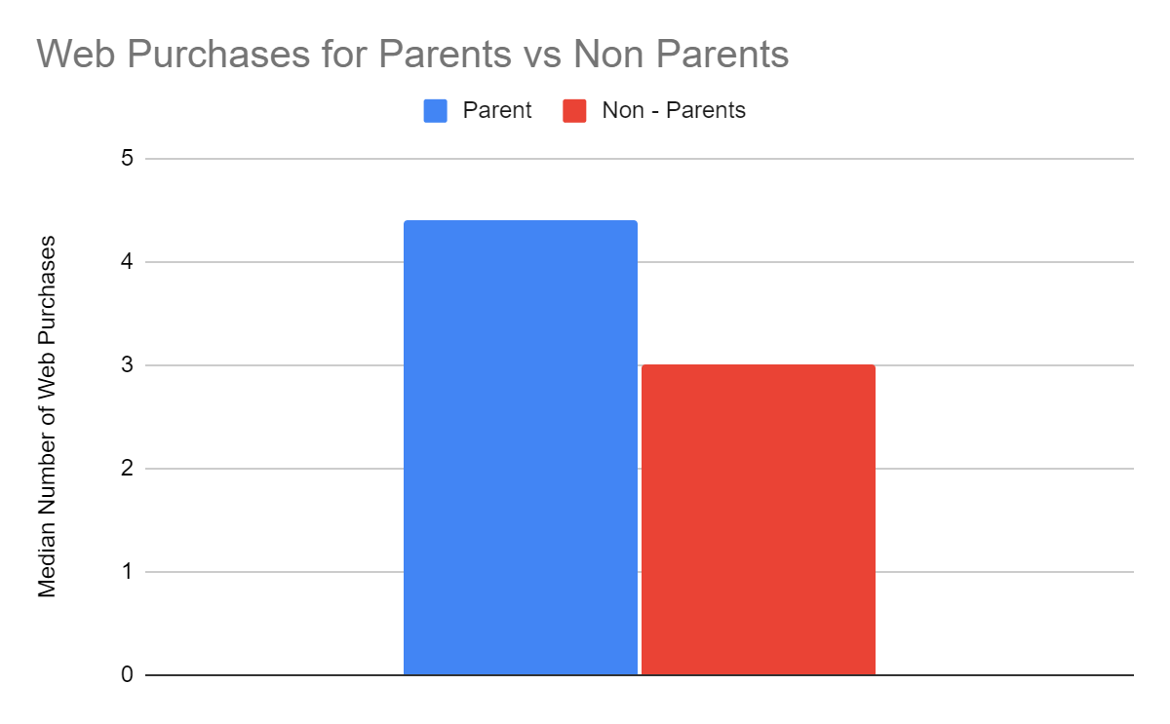
b. Family Effect: Having a family does not necessarily change what the client purchases, but it does affect which channel they choose to purchase from.
3. Data Modeling and Analysis
a. Stepwise Regression Model:
- Income, number of kids, spending on wines, number of purchases are strongly significant to predict number of purchases. On the other hand, education is not statistically significant.
- Customers spend more on wines, the more purchases they make!
b. Semi-Log Regression:
- The log of the amount spent on meat and income in thousands have a positive relationship with total spending.
🎯 Conclusions
- Acquiring High-Income customers drives increased purchases and enhances customer lifetime value
- Meat and wine consumption as income indicators: tailor campaigns to cultural influences shaping consumption patterns
- Family status and education level less predictive than spending capacity
- Stakeholders should prioritize income-based customer targeting over product or channel preferences