⚠️ This is a research project for the Seminar on Business Statistics at National Taipei University. Some content may be in Chinese and translated. Feel free to contact me for more details!
💡 Business Problem
As the number of car accidents on highways in Taiwan is increasing, we aim to identify the contributing factors, including speed, traffic volume, and precipitation. By understanding these factors, we can propose effective methods to prevent such accidents from occurring in the future.
📊 Dataset
- Weather data from the Central Weather Bureau
- Car Accidents data from National Police Agency
- Road section data from Freeway Bureau (Sample size: 24 million)
🛠️ Tools
- Tools: R, SAS, Minitab
- Skills: Web Crawler, Principal Component Analysis(PCA), ANOVA, Paired-sample T-test, Chi-square test of Independence, Stepwise Logistic Regression
🔬 Methodology
1. Data Gathering and Preprocessing
a. Gathered accident data from the National Police Agency for 2020, focusing on National Highways 1 and 3. Using provided latitude and longitude, match these locations to detection station codes with Traffic Data Collection System (TDCS) using R.
b. Segmented the data into 232 sections based on these stations, selecting the top 10 sections with the highest accident rates. Notably, accidents are more frequent on National Highway 1, primarily in the northern region.
c. Acquired median vehicle speeds data from the Traffic Data Collection System (TDCS) provided by the Freeway Bureau using web crawler. This dataset includes average vehicle speeds and traffic volumes between TDCS detection stations, serving as variables for analysis.
2. Exploratory Data Analysis (EDA)
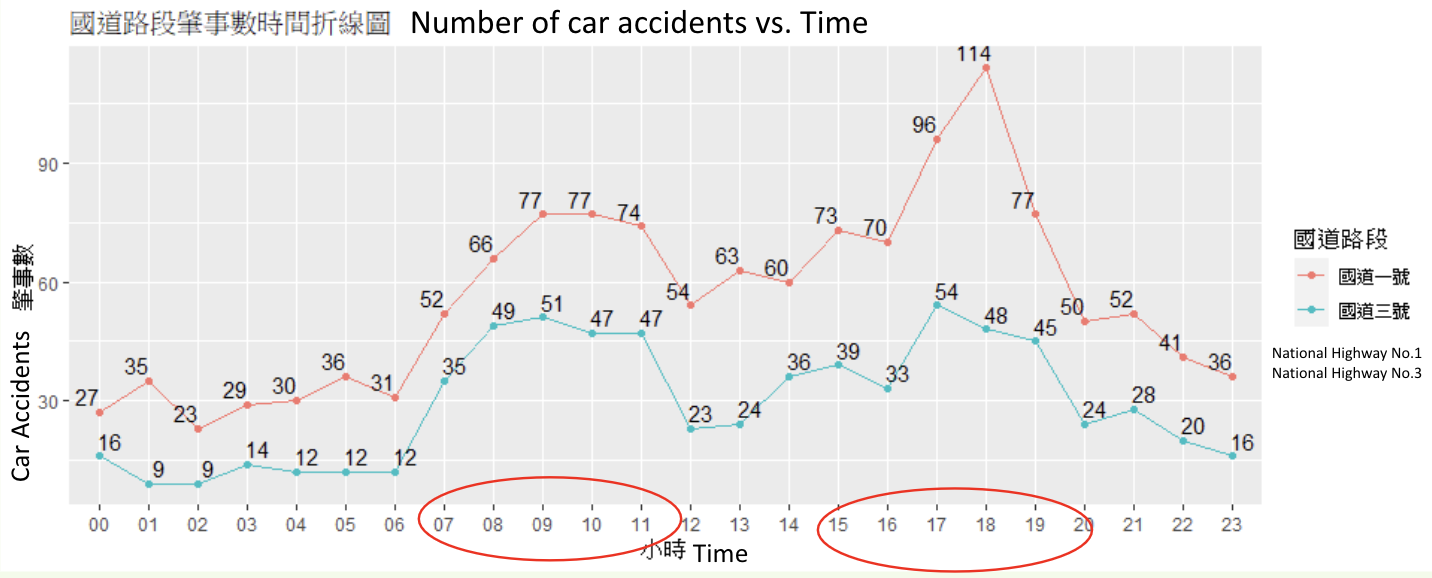
a. Peak Hours Effect: Peak hours for car accidents occur between 7-11 AM and 4-7 PM on both highways.
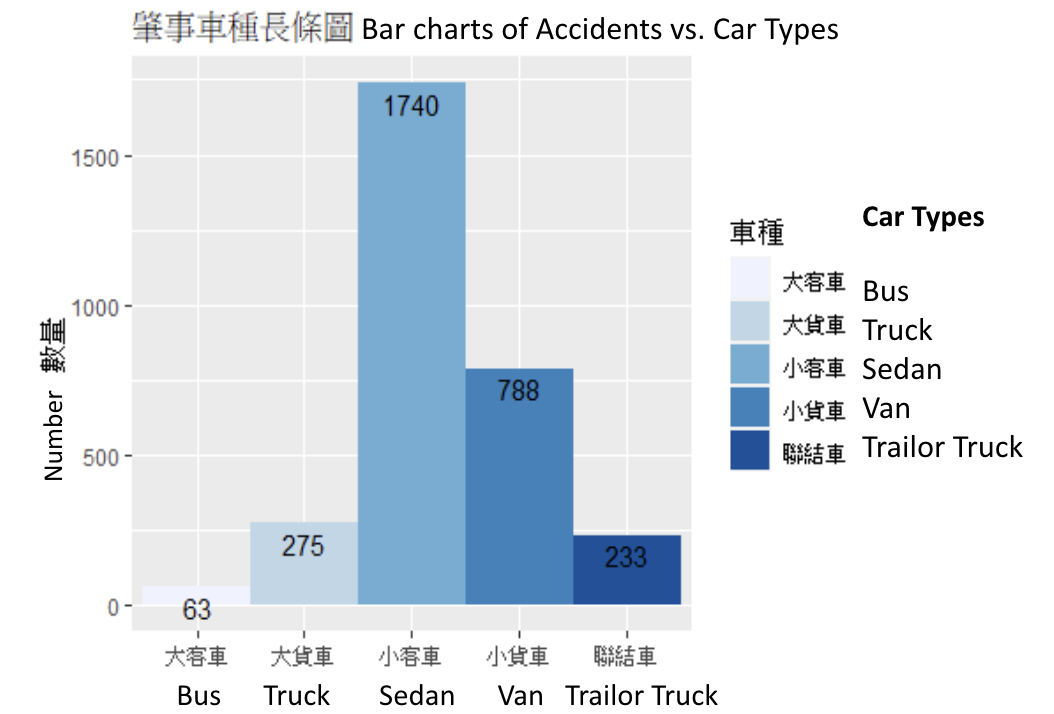
b. Car Type Effect: Sedans contribute the highest number of car accidents.
1. Data Modeling and Analysis
a. PCA was applied to all 232 road segments to condense variable dimensions and identify key factors influencing accidents. However, this approach did not yield suitable variables. Subsequently, it was recognized that each road segment has unique factors affecting accidents, necessitating separate analysis for each segment.
b. Analysis and predictive models will be developed separately for Road Segments 1 to 10. We ran a paired-sample t-test and chi-square test of independence on the continuous and categorical variables, respectively, using Minitab. Continuous variables such as speed, traffic volume, temperature, pressure, wind speed, wind direction, precipitation, and visibility will be utilized. Categorical variables will include peak hours.
c. The occurrence of accidents will be the dependent variable for logistic regression modeling. By our final predictive models, we can conclude that the primary factors contributing to accidents are speed, traffic volume, and peak hours.
🎯 Conclusions
- Accidents are more frequent on National Highway No.1 compared to National Highway No.3, with most incidents occurring in the northern region. This trend is attributed to the higher traffic volume on Highway 1, which connects numerous major cities and industrial areas. Additionally, the dense population and high mobility in the northern region contribute to the elevated accident rates.
- Factors influencing accident occurrence vary among different road segments. The analysis highlights that speed and traffic volume are significant factors, along with precipitation and peak hours, which contribute to increased accident rates.